Plotting a coincedence map
[1]:
%matplotlib inline
import matplotlib.pyplot as plt
import numpy as np

xy_range = ((0, 2), (0, 2))
n = 10000
rng = np.random.default_rng(42)

xdata = rng.normal(0.8, 0.2, size=n)
ydata = rng.normal(1.2, 0.4, size=n)

H, xedges, yedges = np.histogram2d(xdata, ydata, bins=50, range=xy_range)
[2]:
from agepy import ageplot
ageplot.use(["age", "pccp"])
pccp = ageplot.figsize("pccp")
[3]:
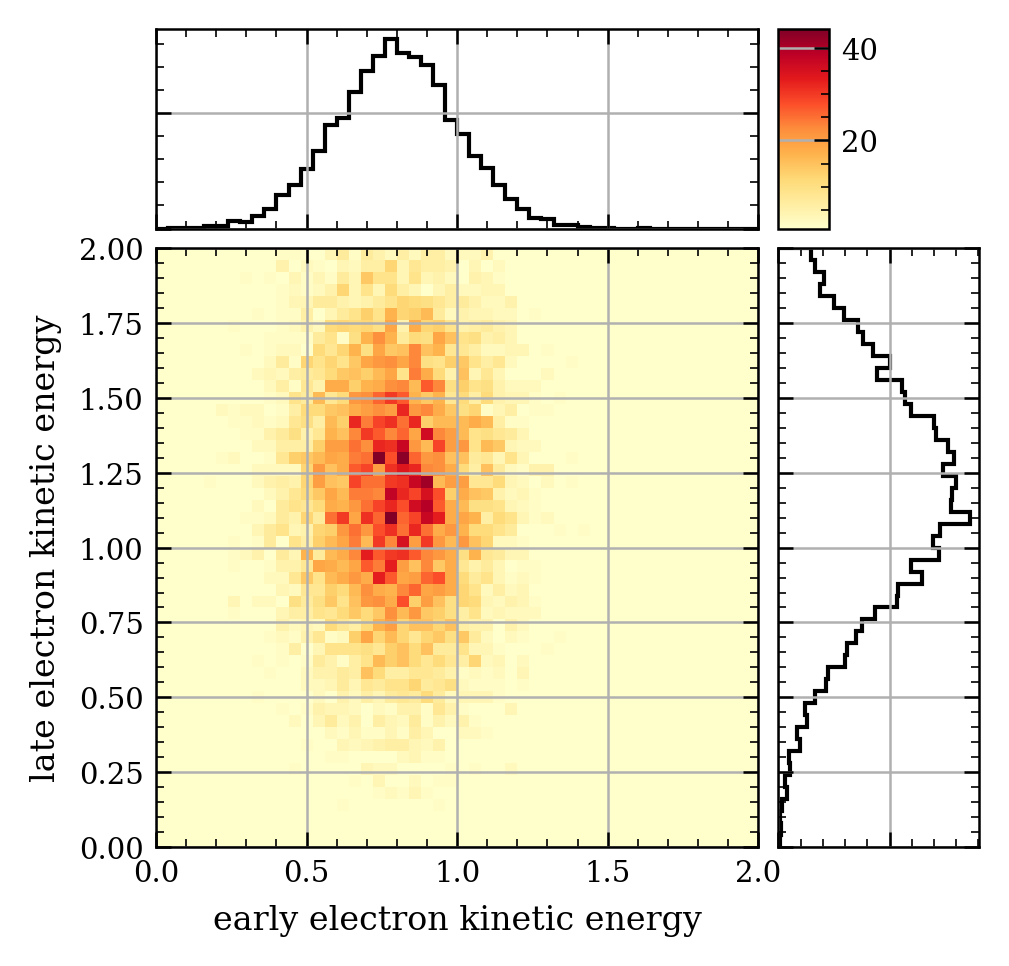
from agepy.spec.coincidence import plot_coinc_map
fig, ax = plot_coinc_map(H, xedges, yedges, figsize=(pccp.w, pccp.w))
plt.show()