How to plot with agepy and matplotlib
This short tutorial is meant to showcase how agepy can help with creating nice plots.
Import some standard packages used in this tutorial, create some data to plot and define a function to plot the toy data.
[1]:
%matplotlib inline
import matplotlib.pyplot as plt
import numpy as np
from scipy.stats import norm, expon

x_range = (0, 2)
n = 10000
rng = np.random.default_rng(42)
sdata = rng.normal(1, 0.1, size=n)
bdata = rng.exponential(size=n)
data = np.append(sdata, bdata)
hist, edges = np.histogram(data, bins=40, range=x_range)
dx = np.diff(edges)[0]
x = np.linspace(*x_range, 1000)

def plot_example():
    plt.clf()
    fig, ax = plt.subplots()
    ax.stairs(hist, edges, label="data")
    ax.plot(x, n * dx * expon.pdf(x), label="background")
    ax.plot(x, n * dx * norm.pdf(x, 1, 0.1), label="signal")
    ax.plot(x, n * dx * (norm.pdf(x, 1, 0.1) + expon.pdf(x)), label="sum")
    ax.set_xlim(x_range)
    ax.set_ylim(bottom=0)
    ax.legend()
    return ax
Applying the AGE style to your plots
Matplotlib styles can be customized using style sheets. The styles included in matplotlib can be viewed here.
In order to use the AGE styles implemented in agepy they first need to be imported with:
[2]:
from agepy import ageplot
The available styles are
[3]:
print(ageplot.age_styles) # Lists the implemented AGE styles
['age', 'tex', 'nature', 'prl', 'pccp', 'powerpoint', 'latexbeamer', 'dataviewer']
[4]:
print(ageplot.mpl_styles) # Lists the matplotlib styles
['default', 'Solarize_Light2', '_classic_test_patch', '_mpl-gallery', '_mpl-gallery-nogrid', 'bmh', 'classic', 'dark_background', 'fast', 'fivethirtyeight', 'ggplot', 'grayscale', 'petroff10', 'seaborn-v0_8', 'seaborn-v0_8-bright', 'seaborn-v0_8-colorblind', 'seaborn-v0_8-dark', 'seaborn-v0_8-dark-palette', 'seaborn-v0_8-darkgrid', 'seaborn-v0_8-deep', 'seaborn-v0_8-muted', 'seaborn-v0_8-notebook', 'seaborn-v0_8-paper', 'seaborn-v0_8-pastel', 'seaborn-v0_8-poster', 'seaborn-v0_8-talk', 'seaborn-v0_8-ticks', 'seaborn-v0_8-white', 'seaborn-v0_8-whitegrid', 'tableau-colorblind10']
To load and use a style call the function ageplot.use(styles) with any string or list of strings from age_styles or mpl_styles.
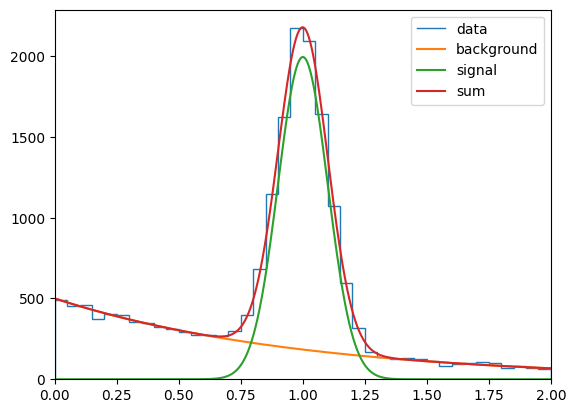
Plotting the example with the default matplotlib style will look like this:
[5]:
ageplot.use("default")
plot_example()
plt.show()
<Figure size 640x480 with 0 Axes>
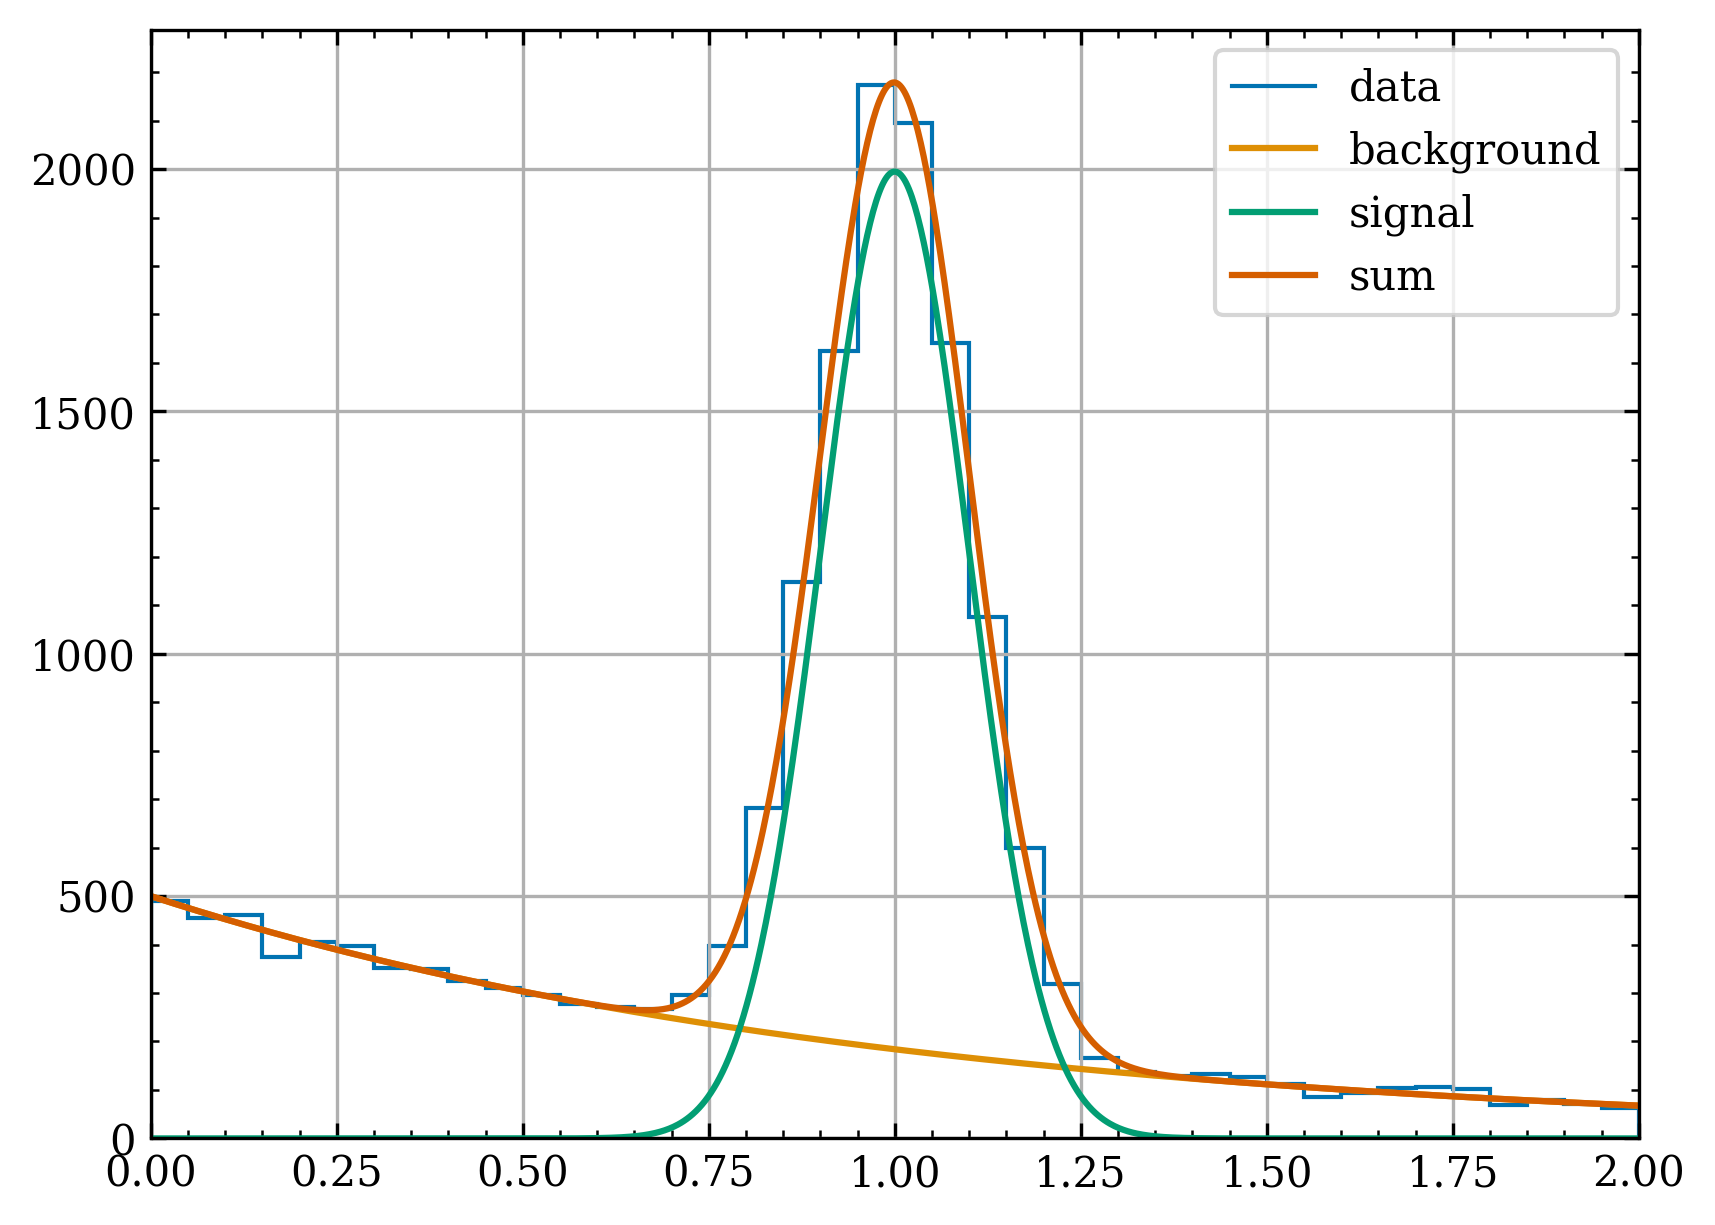
Using the style "age" will
add ticks to top and right axes
change the font to DejaVu Serif
use colorblind friendly colors (from the seaborn colorblind palette)
increase dpi to 300
add a grid
…
[6]:
ageplot.use("age")
ax = plot_example()
plt.show()
<Figure size 1920x1440 with 0 Axes>
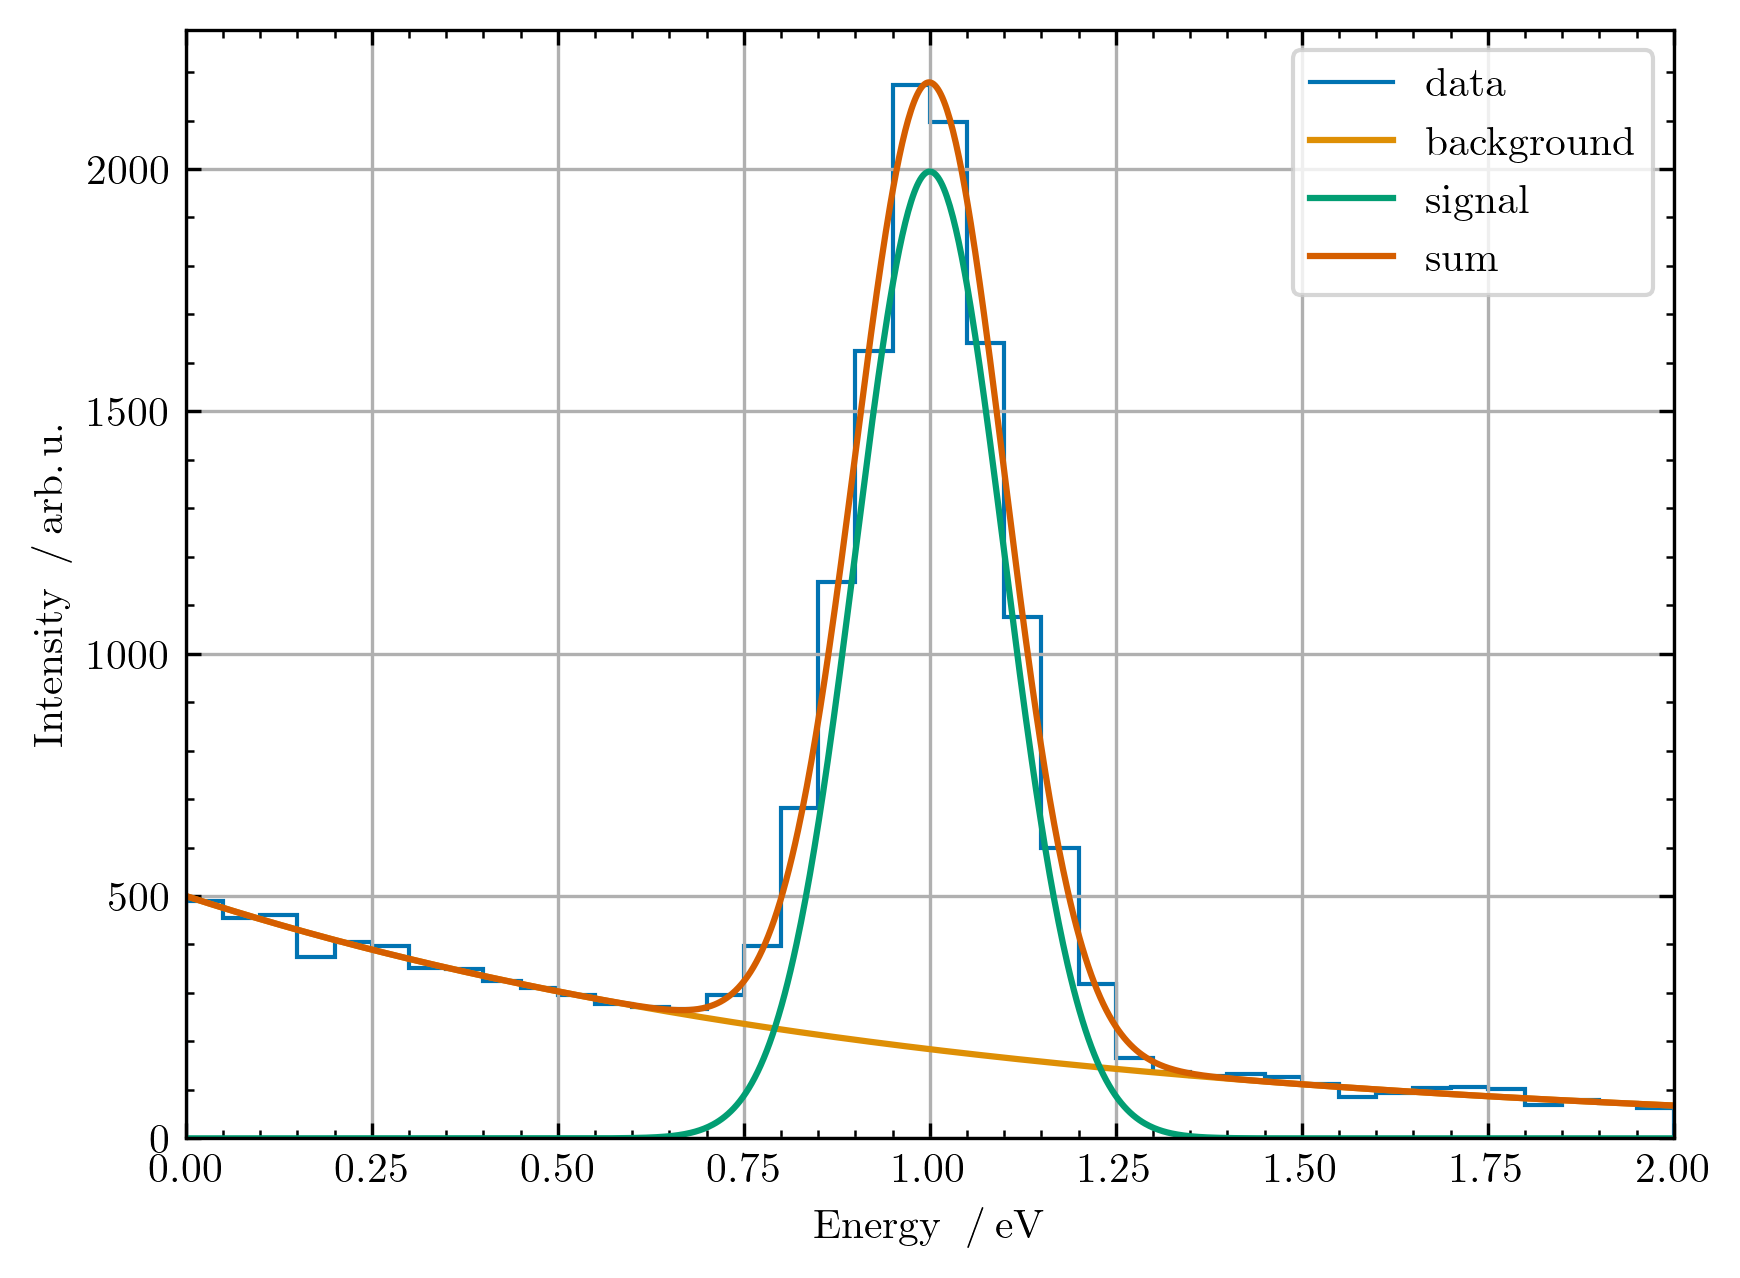
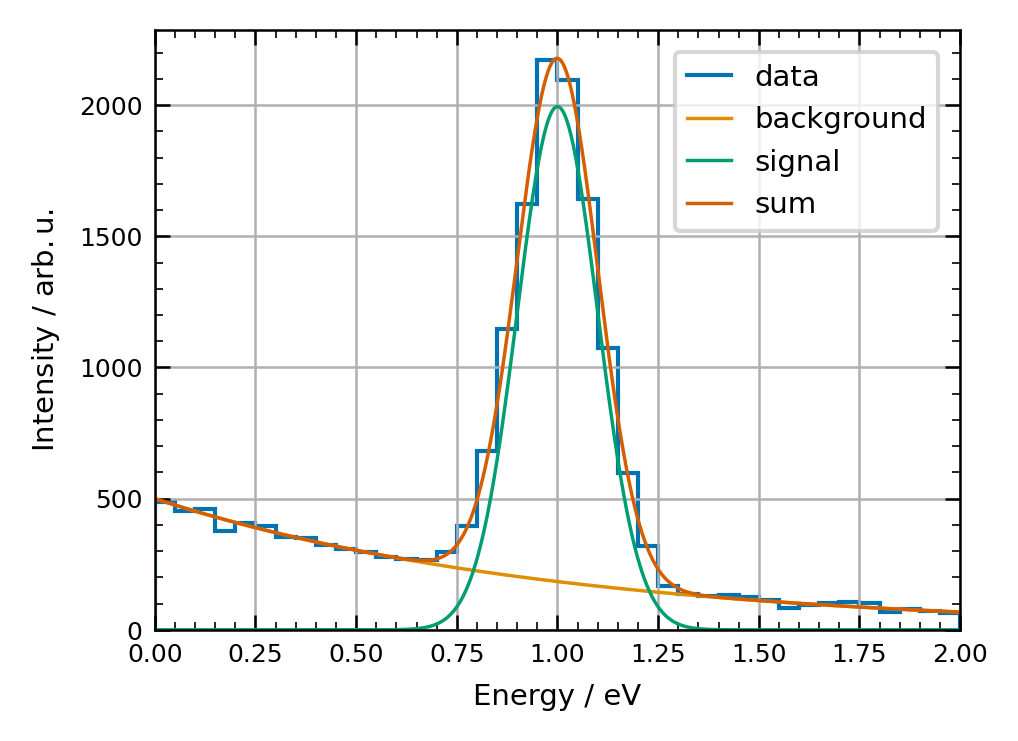
When adding the "tex" style, you can also use the latex siunitx package in your labels and text provided that you have latex installed.
[7]:
ageplot.use(["age", "tex"])
ax = plot_example()
ax.set_xlabel(r"Energy $\:/\: \si{\electronvolt}$")
ax.set_ylabel(r"Intensity $\:/\: \si{\arbitraryunit}$")
plt.show()
<Figure size 1920x1440 with 0 Axes>
Note
The styles are defined in .mplstyle files. In order to add your own style add a .mplstyle file in the src/agepy/plot/ directory. As a reference the file src/agepy/plot/_reference.mplstyle is available, which contains all the available rcParams and their default values.
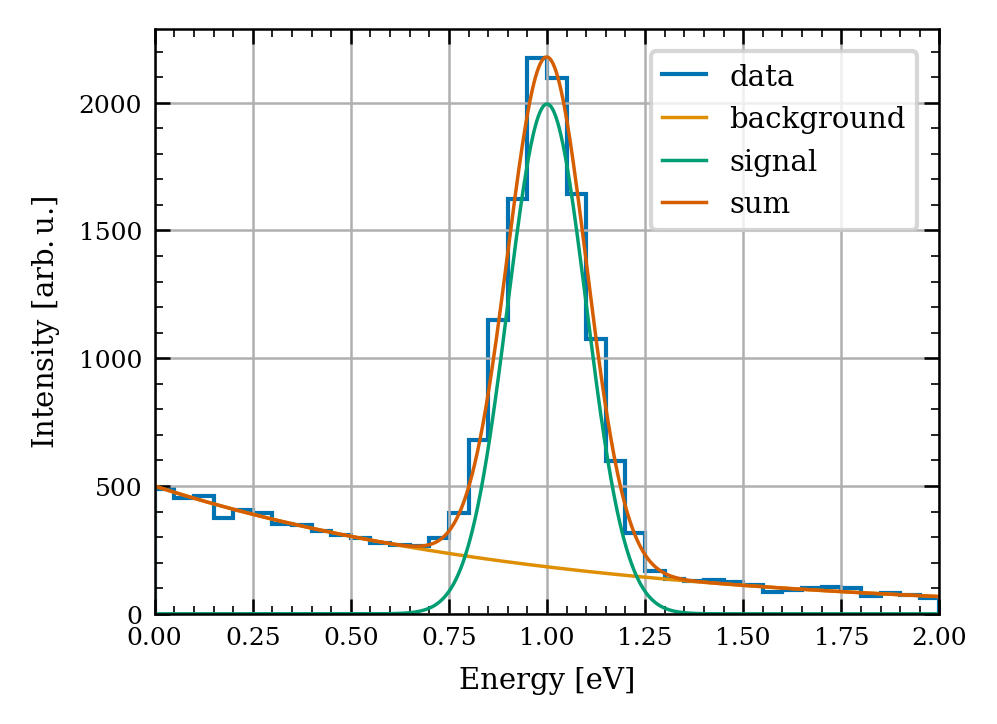
The function ageplot.use() supports specifying multiple style sheets by accepting a list of strings. This enables you to combine styles, which can be useful in some cases. For example, you can combine the "age" style with a style that sets all the linewidth, fontsize and figure size parameters to values specific to the media for which you want to create the plot (e.g. a journal, presentation, thesis, etc.).
[8]:
ageplot.use(["age", "prl"])
ax = plot_example()
ax.set_xlabel(r"Energy [eV]")
ax.set_ylabel(r"Intensity [arb.$\,$u.]")
plt.show()
<Figure size 1012.5x759.375 with 0 Axes>
All style sheets can also be used with a context manager:
[9]:
with ageplot.context(["age", "nature"]):
    ax = plot_example()
    ax.set_xlabel(r"Energy / eV")
    ax.set_ylabel(r"Intensity / arb.$\,$u.")
    plt.show()
<Figure size 1039.2x779.4 with 0 Axes>
Choosing a different figure size
If the figure size set in the style sheet doesn’t work for you, the class ageplot.figsize will help you choose one. ageplot.figsize provides the width and height available in your specified media. You can list the media for which this is implemented with:
[10]:
print(ageplot.figsize.media)
['pccp', 'powerpoint', 'latexbeamer', 'nature2col', 'nature1col', 'prl1col', 'prl2col']
After choosing your media, you have access to a few properties:
[11]:
pccp = ageplot.figsize("pccp")
print("The recommended width:", pccp.w)
print("The available height:", pccp.hmax)
print("The recommended height:", pccp.h)
print("A tuple of w an h for easy use", pccp.wh)
The recommended width: 3.54
The available height: 9.54
The recommended height: 2.6550000000000002
A tuple of w an h for easy use (3.54, 2.6550000000000002)